Introduction
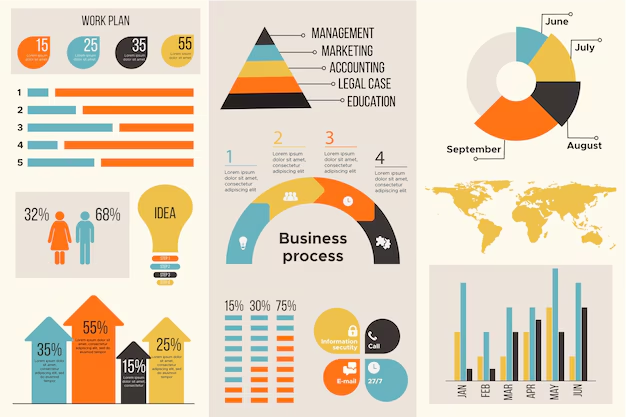
Infographics have really grown to be one of the strongest means of conveying information on the web. In this digital age, attention spans are shorter than ever, and people really prefer their visuals over long blocks of text. This is where creative infographic design comes in. Mixing data, graphics, and storytelling, the design makes complex information easy to understand and visually catchy.
In this guide, we will explore everything there is to know about the creative infographic design, its importance, types, best practices, tools, and practical tips for creating impressive visuals. On the other hand, whether one is a business owner, a marketer, a student, or a designer whole new world awaits them when they learn how to design effective infographics to convey ideas clearly and capture attention.


What is Creative Infographic Design?
When consider designing infographics, it means transforming data, facts, or concepts into a beautiful visual graphic. Good infographic design is much more than giving poor charts; it uses color, typography, icons, illustrations, and layout techniques to attractively present information.
Instead of bombarding viewers with numbers or long body texts, infographics allow users to grasp the general ideas quickly. And this makes infographics a natural choice in blogs, presentations, and various forms of social media, marketing, and education.
Why Infographics Are So Effective
Visual Attraction – People tend to process visual information faster than text. Infographics exploit this advantage.
- Simplicity – It often becomes easy to understand complex data.
- Better Retention – Visuals are better retained in memory compared with plain text.
- Increased Engagement – An infographic grabs attention for social media and websites.
- SEO Advantages- Infographics have the potential to earn backlinks as well as shares to increase search rank.
Focusing on creative infographic designs enables information not only to be shared but also to be memorable.
Types of Infographics
There is no universal standard that can apply to all the infographics; the ones suitable for you will depend on the message you intend to convey. There are various types and categories of infographics.
Here are some of the more common types:
1. Statistical Infographics
Statistical infographics deal with survey data, research data, or some statistical numbers that can be easily understood by the viewers with the help of charts and graphs showing the percentages.
2. Timeline Infographics
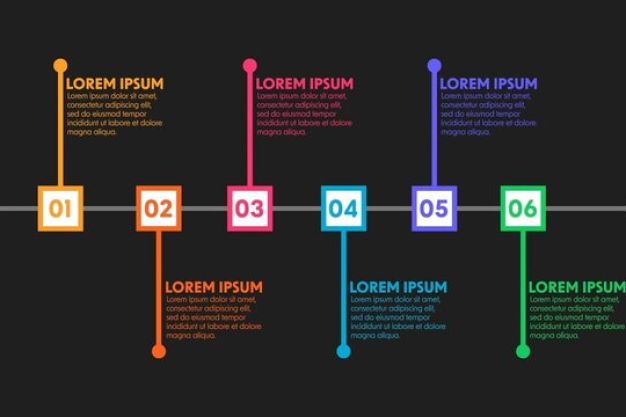
Timeline infographics specifically display a series of related historical events, company happenings, or spectrums of events. A well-crafted timeline infographic can highlight and lead the audience stepwise through the storyline.
3. Process Infographics
Process infographic design types are more suitable for demonstrating processes, tutorials, or instructions. Each step has a very brief description below.
4. Comparison Infographics
They compare two products, services, or ideas. This guides the audience through its decision-making.
5. Geographic Infographics
These types of infographics place an emphasis on maps, places, or demographics in a manner that allows for regional comparison or travel-related content.
6. Informational Infographics
Mostly for educational purposes, these convey their information systematically and creatively.
7. List Infographics
Best suited for communicating a list of tips, facts, or benefits.
Elements of a Creative Infographic Design
Designing an infographic is more than just placing a couple of icons and some text together. An effective infographic is a well-calibrated integration of several elements.
- Color Scheme – Colors should support the concept and facilitate data readability.
- Typography – Fonts that give good readability are important for legibility.
- Icons & Illustrations – The visual elements illustrate long texts.
- Hierarchy – The information should flow logically from start to finish.
- Balance – The design should not look cluttered.
- Branding – Logos or consistent colors can help differentiate a business.
Best Practices for Infographic Design
Let the visual speak to your audience while being structured properly. Try to keep it simple and uncluttered.
- Have only one focus – Infographics do well if they represent one clear idea.
- Show it more than say it – Let visuals (icons, charts, symbols) take the place of textual work.
- Easy to read – Avoid small font sizes and congested layouts.
- Make them easy to share – Consider social media while designing.
- Be consistent across the board – Apply the same color, font, and style throughout.
Search engine optimization – Make sure to include comprehensive alt text and keywords on infographic images.
Benefits of Hiring a Professional Web Developer
Here are some design tips for creating an effective infographic:
- Simplicity – Don’t overload it with too much information.
- Single Focus – Infographics work best with one clear and simple understanding.
- Visualize – Replace paragraphs with icons, charts, or symbols.
- Readable – Avoid small fonts and cramped layouts.
- Shareable – Design in mind for social media.
- Consistency – Use consistent colors and fonts, and styles throughout.
- SEO-friendly – Infographic images must be accompanied by alt text and keywords.
How Businesses Use Infographics
Here are ways they are used by companies:
- For Marketing Content: Blog articles with infographics tend to get more engagement.
- Social Media Campaigns: Infographics are shareable very easily.
- Reports and Presentations: Visualization in the report makes data easy to follow.
- Email Marketing: A short infographic can summarize complex information.
- Comparison Products: Infographics highlight the difference in features.
- Brand Awareness: Consistent design builds brand identity.
Infographic Design Tools
Not everyone is a designer by profession. Luckily, some tools allow you to create infographics more quickly:
- Canva
- Piktochart
- Visme
- Adobe Illustrator
- Venngage
- PowerPoint (for simple infographics)
All these sites offer customizable templates for infographics that you can fill with your own data and branding.
Final Thoughts
This is not simply the creation of beautiful graphics associated with creative infographic design; it also means making information clearer, more memorable, and shareable. Whether you’re a business owner wanting to spread some brand awareness, a marketer looking for more engagement, or a student presenting statistics, infographics can modify the way you communicate.
Dramatic impressions when you design infographics using the correct tools and practices, and focusing on your storytelling.


